

Introduction
Click here to watch brief NPS Benchmarks Video.
Article
For good reason, over the last few years Net Promoter Score (NPS) has gained prominence as a key metric of company performance. Companies with “good” NPS scores retain a higher share of their current customers, sell more to their current customers, and attract more new customers due to strong word of mouth and references from their current customers. The inverse is true for companies with low NPS scores.
While measuring NPS is relatively easy (For a primer on NPS scores and how to measure them, click here), ultimately what matters is not the number itself, but how your score compares to your competitors. It is the NPS leader in a given market that achieves superior growth.
So what is a good Net Promoter Score for a Business to Business Information Technology vendor?
Category NPS
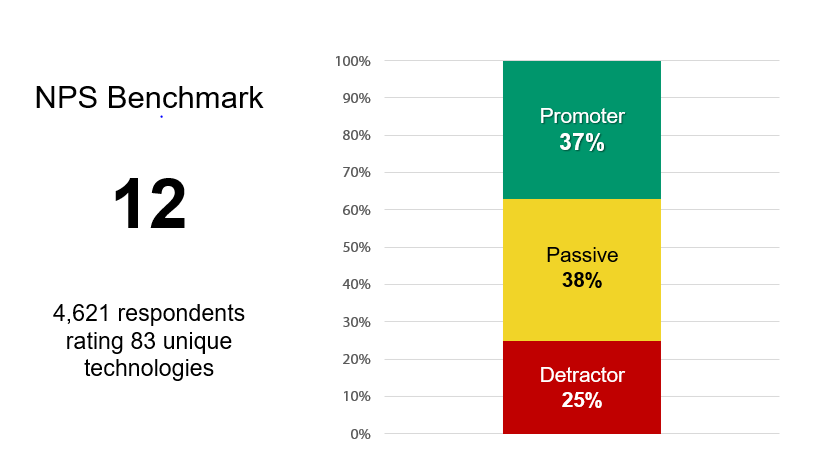
Over the last several years, Topline has gathered Net Promoter Score’s from over 4,600 decision makers, champions and users on 83 different B2B IT solutions. The large majority of the companies benchmarked have between $20M and $1B in revenue, with the remainder about equally split above and below this range.
What we found was a Net Promoter Score of 12 for the category as a whole.
Topline Category NPS for Mid Market B2B Information Technology
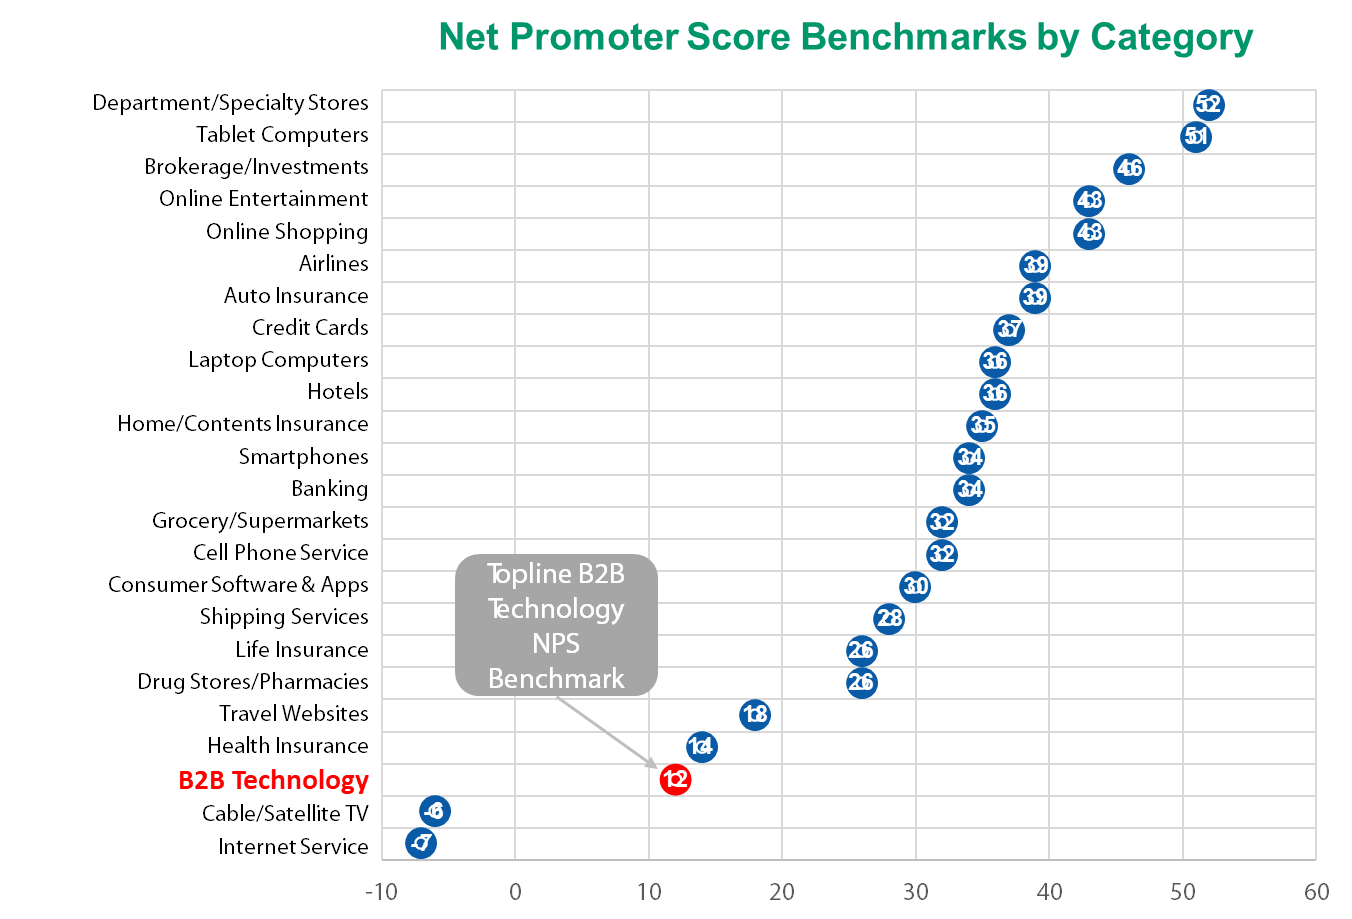
Mid Market B2B Tech Category NPS vs. Other Categories
When compared to other categories, especially consumer products and services, B2B Information Technology ranks just below Health Insurance Companies and somewhat above Cable/Satellite TV providers, two categories that people do not express a lot of affection for.
The reason for the low category score has to do with the nature of B2B IT solutions themselves:
- Complexity: The solutions themselves range from somewhat complex to very complex. Even the simplest B2B technology solution is considerably more complex than almost every consumer product and service.
- Multiple Stakeholders: B2B technology solutions have multiple stakeholders and users that have different needs and it is very difficult to satisfy everyone.
- Works in Progress: B2B technology solutions are practically unique in that they are sold as a work in progress. When customers buy B2B tech solutions, they do so knowing that they will need to wait for upgrades, updates and add ons to get what they truly want.
The Category NPS for B2B IT Ranks Near the Bottom, Just Below Health Insurers and Above only Cable/Satellite TV Providers and Internet Service Providers
Benchmarking Your NPS Score
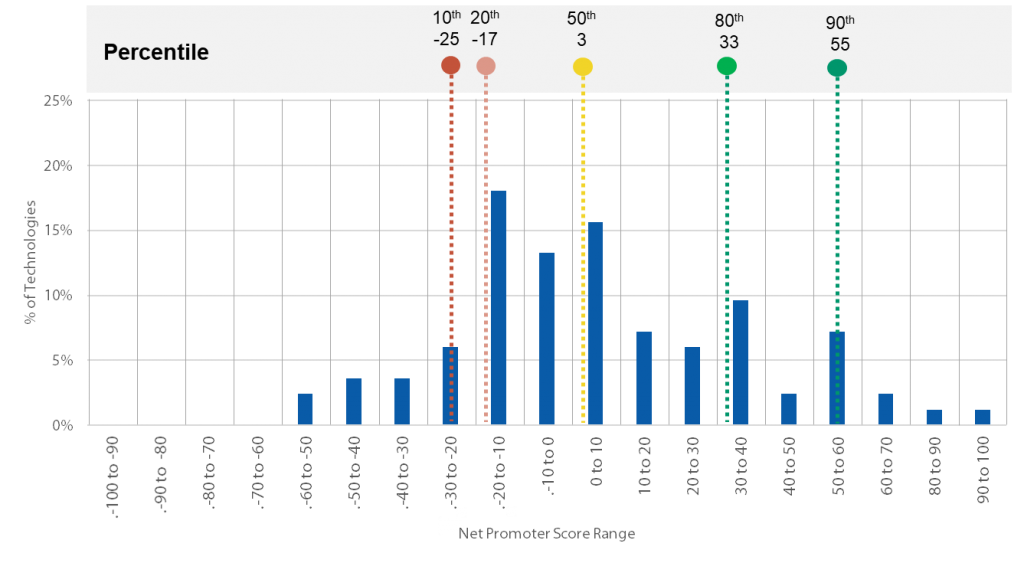
Comparing your NPS to the category is a good place to start in understanding your NPS. If it is over 12, you know you are above average and if it is under 12, you know you are below average. However, if you want to know how well (or poorly) you are doing, the following chart shows the distribution of scores for each of the 83 technologies along with the 10th, 20th, 50th, 80th and 90th percentiles.
As you can see on the chart, while the category average NPS is 12, the median NPS (50th percentile) is 3 while Very Poor (10th percentile) is -25 and Excellent (90th percentile) is 55.
Net Promoter Score Distribution by Technology (n=83 technologies)
If you would like to learn more about NPS and how Topline can help your company implement a NPS program or assist in understanding and improving your current NPS score, you contact us at info@toplinestrategy.com or click Contact Us.